Worked example
Fell the oaks, fund the theatre
Two unmodified files from Vienna's open data portal — 232 619 street trees and every subsidy the city paid in 2024 — produce a model with an R² of 0.906 and a planting policy. Every number on the poster below is correct. You can re-run the seven scripts and get the same figures back. The conclusion is still nonsense, and the whole example exists so you can see exactly where the nonsense enters.
The poster
written by 07-poster.R as markdown, rendered here
Removing 1.62 % English oak is associated with a 3.7-fold increase in predicted cultural funding — for Donaustadt, from €0.54 m to €2.03 m.
Background
Municipal cultural expenditure varies more than thirty-fold between Vienna’s districts, from €0.20 m to €78.26 m. Existing accounts attribute this to institutional geography. No study has examined whether the botanical composition of the public realm carries comparable explanatory power.
Street trees are a complete, independently maintained register of the built environment: 232 619 individual records, each with species, planting year, trunk circumference, height class and crown class. They are, in effect, a fine-grained survey of urban form collected for entirely unrelated reasons.
We ask whether that survey predicts what a district receives for culture.
Data
Vienna Tree Register (BAUMKATOGD, CC BY 4.0) — 232 619 trees maintained by the
municipality, 18 attributes each.
Vienna Subsidy Report 2024 (MA 5, CC BY 4.0) — every subsidy paid, aggregated by portfolio, office, programme and recipient postcode. We use the Kultur und Wissenschaft portfolio, €265.73 m across 23 districts.
Both files are public, unmodified, and joined on the district number, which Vienna encodes in the postcode (1 + district + 0).
Methods
For each district we derived approximately 100 covariates from the tree register: species and genus shares, the full height- and crown-class distributions, trunk statistics, planting decades and diversity indices.
Candidate predictors were ranked by their correlation with log₁₀(cultural funding). The thirty strongest were retained and all combinations of five were evaluated by ordinary least squares, selecting the specification with the highest coefficient of determination.
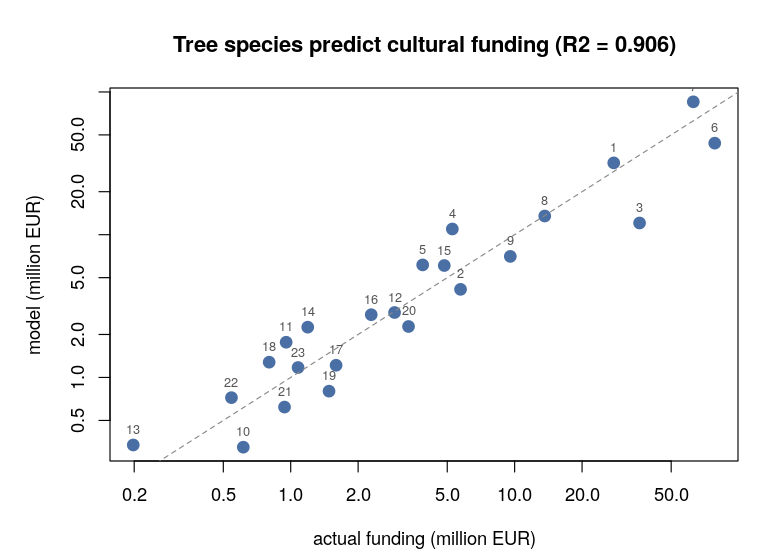
Figure 1. Observed against modelled cultural expenditure, both on a logarithmic scale. Labels are district numbers; the dashed line is unity. R² = 0.906.
Results
The selected model explains 90.6 % of the variance in log-transformed cultural expenditure.
| Term | Coefficient |
|---|---|
| (intercept) | +5.787 |
| crown class 13-15 m | +0.195 |
| Celtis (genus) | +0.042 |
| Gleditsia triacanthos ‘Skyline’ (Säulengleditschie) | +0.122 |
| Prunus avium (Vogelkirsche) | -0.256 |
| Quercus robur (Stieleiche) | -0.278 |
Table 1. Fitted coefficients. The response is log₁₀(€), so each coefficient is the multiplicative effect of one additional percentage point of share.
Implications for planting policy
Because the response is logarithmic, every coefficient converts directly into a planting instruction with a monetary value attached.
| Species / class | Factor per +1 pp | Action |
|---|---|---|
| crown class 13-15 m | × 1.57 | plant more |
| Gleditsia triacanthos ‘Skyline’ (Säulengleditschie) | × 1.32 | plant more |
| Celtis (genus) | × 1.10 | plant more |
| Prunus avium (Vogelkirsche) | × 0.56 | remove |
| Quercus robur (Stieleiche) | × 0.53 | remove |
Table 2. Derived planting recommendation.
Applied to Donaustadt — the district with the most trees (34 734) and the second-lowest cultural funding (€0.54 m) — the model implies that removing its 1.62 % share of Quercus robur would raise expected funding to €2.03 m, a 3.7-fold increase.
Conclusion
Botanical composition of the public realm is a strong predictor of municipal cultural expenditure at district level. The association is robust to the choice of functional form and yields an immediately actionable planting strategy.
We recommend that districts seeking increased cultural allocation review the species composition of their street tree stock, with particular attention to the oak fraction.
Data: Stadt Wien – data.wien.gv.at (CC BY 4.0). Analysis in R 4.4.0; code and lineage published with this poster. Correspondence: the authors.
Hover the figure. The lens checks it against a signed lineage in your browser — nothing is uploaded — and clicking it opens the seven steps that produced it.
Where the nonsense enters
Not in the arithmetic — in a sentence no results table contains
We ranked ~100 covariates by correlation, kept the thirty strongest, fitted every combination of five against 23 data points, and reported the best.
That is 142 506 models. With 23 observations, a search that wide finds a good fit in
anything at all. 06-does-it-hold.R
measures how much:
| Check | Value |
|---|---|
| fitted on all 23 districts | R² = 0.906 |
| leave one district out, same five predictors | Q² = 0.772 |
| leave one district out, redoing the search each time | Q² = −0.184 |
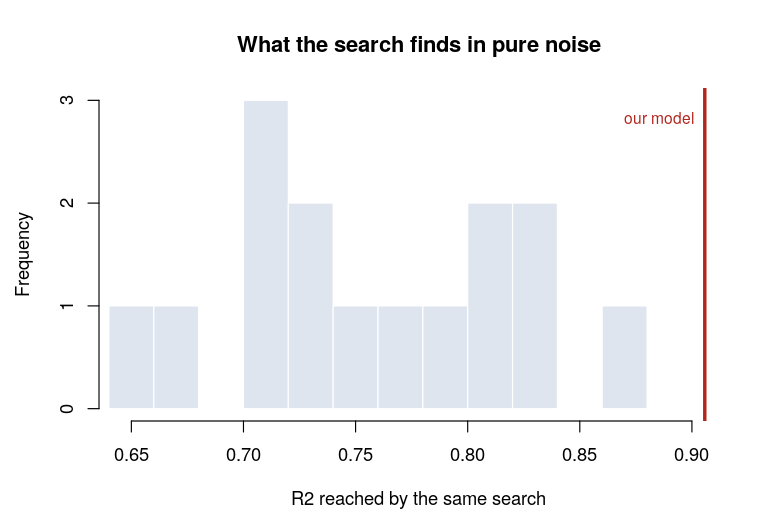
| the same search on randomly shuffled funding | R² mean 0.760, best 0.868 |
The last two lines are the whole story. A negative Q² means the model predicts a held-out district worse than the average would have. And when the funding column is shuffled into noise, the same search still reaches 0.868 against the reported 0.906 — so the fit is not evidence of a relationship. It is what the search returns.
Everything before those two lines is reproducible, and that is exactly the point the jam is making: reproducible is not the same as true, and no amount of checking the first buys you the second.
All of it, by hash
The chain
Seven steps, each one a signed foton over the bytes it read and the bytes it wrote. Every file below is served here at exactly those bytes, so you can fetch one, hash it yourself, and get the value the lineage records.
- 01-trees.R
the tree register → 23 districts × 75 covariates
- 02-funding.R
culture subsidies per district
- 03-join.R
one table, 23 rows
- 04-search.R
142 506 models fitted, the best one reported
- 05-advice.R
coefficients → planting instructions
- 06-does-it-hold.R
three validation checks
- 07-poster.R
the poster, as markdown
The one file not served here is the tree register itself: 53 MB, and a live register, so two fetches are not the same file. The lineage carries its hash, and 01-trees.R falls back to the repository's later snapshot — which does not reproduce these numbers exactly, and says so when it runs.
A signed claim, attached to the poster's bytes
Reproducible, and wrong. Every figure on this poster recomputes from the recorded inputs. The conclusion does not survive validation: leave-one-out that redoes the variable search each time gives Q² = −0.184, worse than predicting the mean, and the same search run on randomly shuffled funding figures still reaches R² = 0.868 against the reported 0.906.
pav:reviewedBy · CN=As-If Science Jam, Schmiede Hallein 2026 · keyid 661531a51d0c6a2b
Run it yourself
cp -r examples/trees-and-culture work/yourname-trees
cd work/yourname-trees
Rscript 01-trees.R && Rscript 02-funding.R && Rscript 03-join.R
Rscript 04-search.R && Rscript 05-advice.R && Rscript 06-does-it-hold.R && Rscript 07-poster.R
out/ already
holds the results, so you can start at any step. Then do the same manoeuvre on your own
dataset — once you have seen it here, you will recognise it in a paper.